|
CD-DVD System Simulation &
Evaluation |
|
This page demonstrates
capabilities in optical design, simulation, and evaluation of single-beam and
multi-beam CD and DVD systems. The simulation is comprehensive,
namely, it starts with the laser beam and ends with analyzing the actual
signals that are generated by the detectors and evaluation of the jitter. The
beam is traced through the system using both geometrical and physical optics
so that the beams on the detectors include aberrations of the various optical
elements in the system as well as diffraction effects. In addition to the
evaluation of the jitter, the simulation is also used for:
•
Calculating the cross-talk between tracks and
evaluating various cross-talk canceling methods.
•
Calculating focusing signals and comparing
various auto-focus mechanisms.
•
Calculating tracking signals and comparing
tracking methods (i.e., push-pull, differential phase delay). Contact For more information and to learn
how you can take advantage of these capabilities contact: tania@numerit.com |
|
Examples |
|
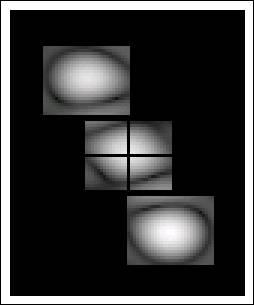
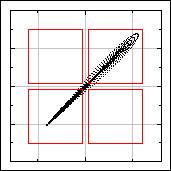
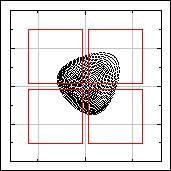
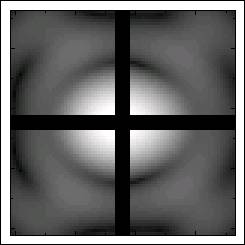
Data signals Figure 1 shows a simulation
of a three-beam DVD system. Fig. 1a shows the simulated illumination spots on
the disc and Fig. 1b shows the calculated spots on the detectors. Note that
the central detector is divided into four segments that are used for
generating the focusing and tracking signals. The signals in the left and
right detectors may also be used for cross-talk cancellation.
(a) (b) Figure
1. (a) Simulated illumination
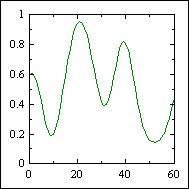
spots on the disc (b) Calculated image on the detectors Segments of the signals that
are generated by each of the three detectors are shown in the following
plots:
Left
track Central
track Right
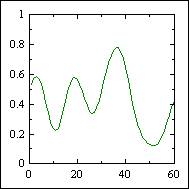
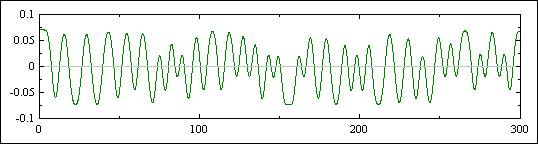
track Figure 2. Signals on the detectors Figure 3 shows a typical
signal that is generated by the simulation. The signal is then further
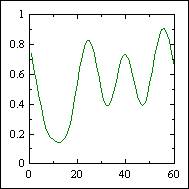
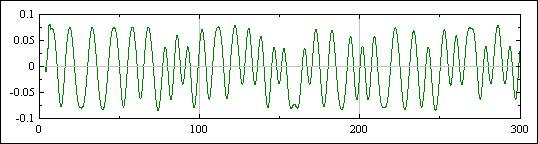
processed by applying a lowpass filter and an equalizer (Fig. 4). The
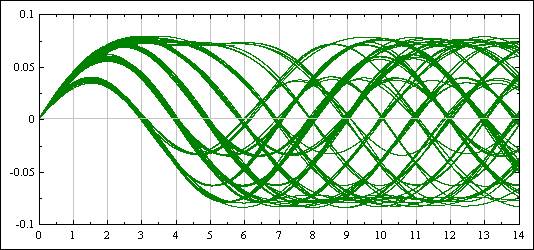
resulted signal is then used for generating an eye-pattern from which the
jitter is evaluated (Fig. 5).
Figure 3. Row signal
Figure 4. Signal after filter and equalizer
Figure 5. Eye-Pattern.
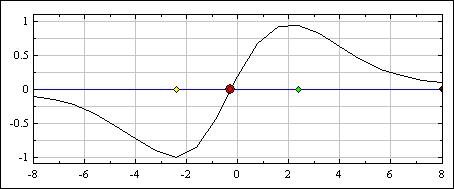
Calculated jitter = 4.6 % Focusing The next example demonstrates
how the simulator is used for generating the focusing signals. The signals
received by the focusing detectors are used for calculating the S-curve.
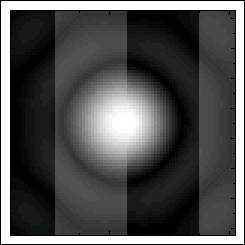
(a) (b) (c) Figure 6. Spots on
focusing detectors: (a) before focus (b) in focus (c) after focus
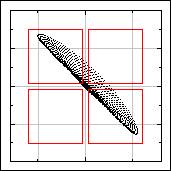
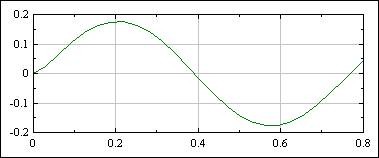
Figure 7. S-curve Tracking Here we see a simulation of
the tracking system with a DVD-RAM. In this simulation the simulated spot on
the grooves of a DVD-RAM is detected by a quadrant detector (Fig. 8). The
signals are used to calculate a push-pull signal for generating a tracking S-curve
(Fig. 9).
(a) (b) Figure
8. Tracking in DVD-RAM.
(a) Simulated illumination spot on the disc grooves
Figure 9. Tracking S-curve |